Winner, Winner, (Rubber) Chicken Dinner
Learn Which Minnesota Congressperson Raised the Most Money in 2014
The FEC recently opened up an API for accessing all of the usual disclosure data. It includes committee information, summaries, and even individual contribution information. For normal people this is not a big deal, but for nerds like me it is a huge improvement for researching campaign fundraising . Previously, you had to rely on the kindness of strangers(Opensecrets, etc.) or build your own database from massive text files.
Now the new Open FEC API can be used to see which member of Minnesota's Congressional delegation raised the most money in 2014. An API key is need to access the service and you can sign up here. I used a Jupyter notebook, repo here to develop the code in this post. I want to give a big shout out to the Sunlight Foundation and their article about using the API. I will borrow several concepts and functions outlined in their tutorial. Definitely worth a read, it's a great primer and has a lot of helpful background information.
Setup
First, I created a new notebook and saved my API key as a plain text file in the same folder as your notebook. Import the necessary libraries (there are a lot of them so refer to the notebook). The main packages are requests, pandas, matplotlib, and seaborn. The last two are just for visualization, so are not needed if you just want to grab the data. Be sure to copy in the functions all_results and count_results from Sunlight Foundation example (there is a copy in my sample notebook too). Next I set the variables for the API calls.
BASE_URL = 'http://api.open.fec.gov/v1'
API_KEY = open(os.path.expanduser('~/api.txt'),'r').read().strip()
With the variables set, I can start figuring out who raised the most in 2014. I'll start by getting a list of candidates from 2014 in Minnesota. To make it easier on myself, I set the parameters for the search into a variable that we can pass to the functions from earlier.
q_mn_2014_candidates = {
    "cycle": 2014,
    "state": 'MN',
    "candidate_status": "C",
    'designation': 'P'
}
This will search just designated candidate's primary committees from Minnesota in 2014. For additional search paramters, check out the API's documentation. With our parameters set, I test out the query with the count_results function as shown below.
count_results('/candidates', q_mn_2014_candidates)
This returns 23 committees which seems about right. Let's take a look at the list.
mn_candidates_2014 = [c for c in all_results('/candidates', q_mn_2014_candidates)]
mn_2014 = pd.DataFrame(mn_candidates_2014)
mn_2014[['name']]
I use a list comprehension to pull all the results of our query into list. Then move that list to a Pandas dataframe and check the list of names. I will be using mn_candidates_2014 in later API calls to get more details on these committees.
*EDIT - For some reason, Mike Obermueller's 2014 committee is not listed. It is not clear to me why it is excluded, but you can manually add him to the list.
Next, I pull together some committee totals to compare fundraising prowess. The code is below and a walk-through of steps follows.
mn_2014_totals = []

for i, row in mn_2014_committees_df.iterrows():
    endpoint = '/committee/{c}/totals'.format(c=row.committee_id)
    for res in all_results(endpoint, {'cycle':2014}):
        mn_2014_totals.append(res)

mn_2014_totals_df = pd.DataFrame(mn_2014_totals)
mn_2014_totals_df.head()
mn_2014_totals_df[['committee_id','contributions','disbursements','receipts',]].head()
The first line initializes a list to append results into. Then the function iterates over the committee names in mn_2014_committees_df from earlier. For each of the committees I make an API call for totals using the all_results function from before. The results are then appended to mn_2014_totals and the list is moved to a Pandas dataframe. Finally, I can graph the results and see who raised the most.
rcParams['figure.figsize'] = 10, 5
mn_2014_comm_totals.set_index('name')[['contributions', 'disbursements']].plot(kind = 'bar')
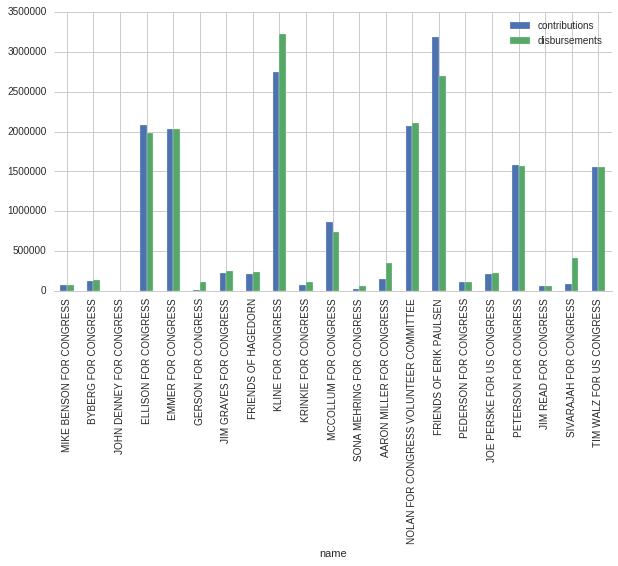
As you can see from the chart, Rep. Erik Paulsen is the winner followed by Rep. John Kline. Even though this answered our initial question, let's keep digging. How much did each committee raise from individuals as opposed to PACS? The dataframe from above can be used by just selecting different columns.
figsize=(10,10)
mn_2014_comm_totals.set_index('name')[['individual_itemized_contributions', 'individual_unitemized_contributions',       'other_political_committee_contributions',]].plot(kind = 'bar', stacked = True)
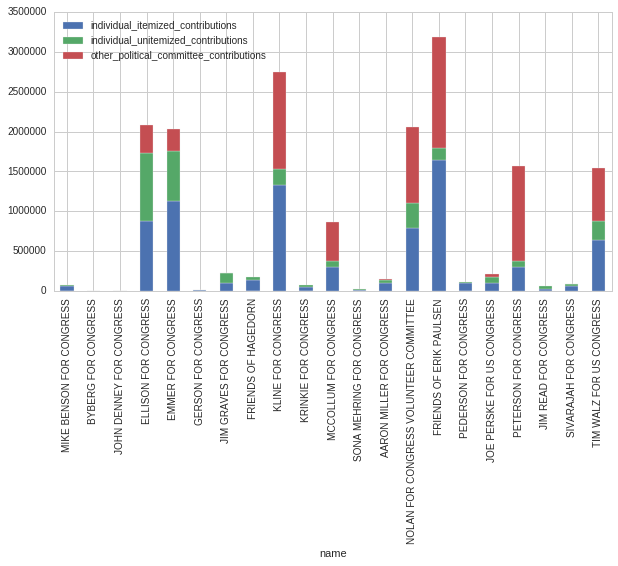
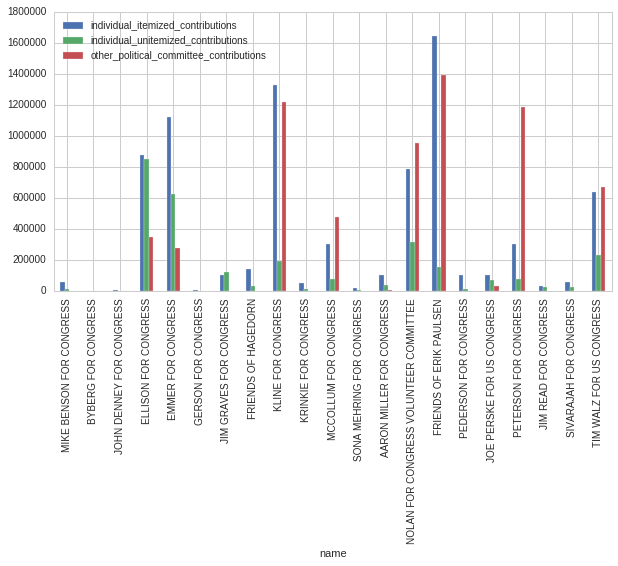
But who raised the most from PACS? Individuals?
figsize=(10,10)
mn_2014_comm_totals.set_index('name')[['individual_itemized_contributions', 'individual_unitemized_contributions', 'other_political_committee_contributions',]].plot(kind = 'bar')
The FEC also has individualized contribution information available. Without getting into too much detail, let's look at who had the most high-dollar donors and the most small-dollar donors. Luckily, the FEC provides donation counts by amount. I will use the same pattern as before, but with a different endpoint from the FEC API.
mn_2014_donors = []

for i, row in mn_2014_committees_df.iterrows():
    endpoint = '/committee/{c}/schedules/schedule_a/by_size'.format(c=row.committee_id)
    for res in all_results(endpoint, {'cycle':2014}):
        mn_2014_donors.append(res)


mn_2014_donors_df = pd.DataFrame(mn_2014_donors)
mn_2014_donors_df.head()
This returns counts by committee using the schedule_a section of the API to return individual contribution data. We can use Seaborn's factor plot to display the data for counts by donation size for each committee.
f = sns.factorplot(y='name', x = 'count', hue = 'size', data = mn_2014_ind_totals, kind = 'bar', size = 10)
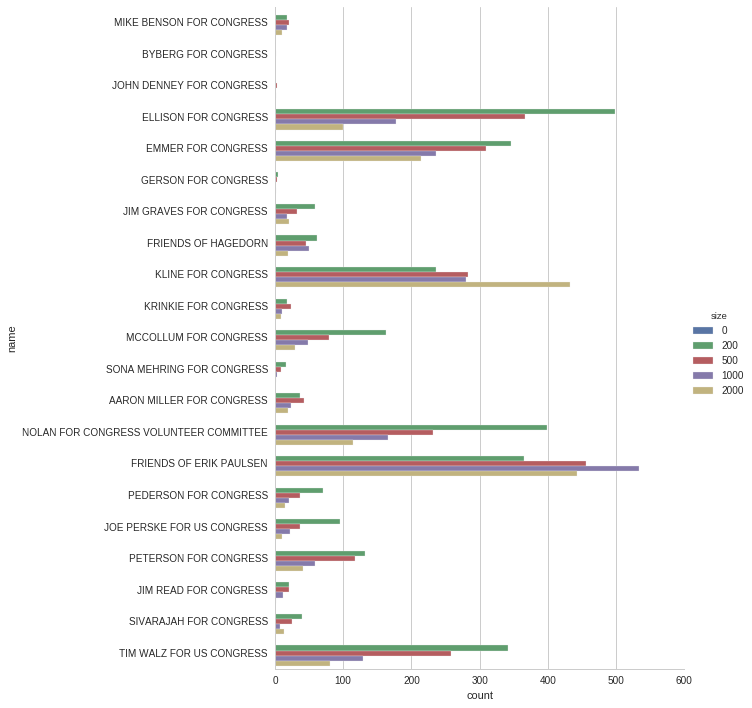
We can see that Rep. Ellison has the most small dollar donors by quite a margin. Depending on how you define it ($1,000+ or $2,500), the large donor count award goes to either Rep. Paulson or Rep. Kline.
The OpenFEC API makes it easy to quickly gather information about the candidates without depending on resources outside of the FEC. Having the itemized contribution data available opens up a lot of potential for research, including factoids like, "Rep. Fakey McFakerson spent $40,000 on Skittles". More to come soon.
Comments
comments powered by Disqus