Minnesota 2014 State House Statistics - part 3
More election statistics than you can shake a stick at
This is the third installment in examining the State House election results from 2014. In this installment we will calculate statistics about each district based on election returns. In an earlier post, we pulled results for State House in 2014 at the State House level. For this project I will pull results from all state and federal races in Minnesota since 2012 at the precinct level. For fellow campaign hacks, this will resemble stats you receive from NCEC. The main focus will be on creating two metrics:
| Metric | Desc. |
|---|---|
| Democratic Performance Index | The number/percent of votes the average democrat can expect in a district |
| Democratic Base | The minimum democratic vote in a district a democrat could expect to win |
Example notebooks here and here
Election Results
The first step is to download the precinct level results for each election and read them into a dataframe. The Secretary of State has all of this data available online. They do regularly update the site so be sure to double check links before following along. FYI - Between when I did the initial analysis and wrote this post, they have updated the links to the spreadsheets. The SOS regularly updates the website so double check links before using.
url14 = 'http://www.sos.state.mn.us/media/1448/2014-general-federal-state-results-by-precinct-official.xlsx'
e2014 = pd.read_excel(url14)
e2014['Year'] = '2014'
e2014.shape[0]
e2014.head()
The above code uses the link to read the election results from Excel into a dataframe. The last two lines of code give us the number of rows and a sample of the first five rows. The code for 2012 is the same except for the download url.
Unsurprisingly, there are a slightly different number of rows for each election. The SOS's office combines precincts for reporting but occasionally varies which are combined each year. For example, all of Apple Valley Ward 1 may be reported as one entry and in another year Apple Valley W1-P1 and W1-P2 are reported separately. My goal is to eventually find a source that reports the same precincts every year, but I will save that for another time. In the meantime, I will deal with the mismatch by aggregating to the State House District by year and then combine the results.
cols2014 = ['MNLEGDIST', 'TOTVOTING', 'USSENDFL', 'USSENTOTAL', 'USREPDFL', 'USREPTOTAL', 'MNLEGDFL', 'MNLEGTOTAL', 'MNGOVDFL', 'MNGOVTOTAL',
            'MNSOSDFL', 'MNSOSTOTAL', 'MNAUDDFL', 'MNAUDTOTAL','MNAGDFL', 'MNAGTOTAL']
e2014 = e2014[cols2014]
e14 = e2014.groupby('MNLEGDIST', as_index = False).sum()
e14.head()
First I select the columns we want to aggregate. Since the file has raw vote totals, I can pull the democratic candidate results and the total votes for each office. The rest can be calculated from these totals. The next step is to sum by district using the Pandasgroupby function. We can simply repeat this process for 2012.
Next, I go through and calculate the percentage of votes that each office (Governor, Senate, etc) received in each State House District. The code used for the 2014 results is below:
e14['USSENPERC'] = e14['USSENDFL']/e14['USSENTOTAL']
e14['USREPPERC'] = e14['USREPDFL']/e14['USREPTOTAL']
e14['MNLEGPERC'] = e14['MNLEGDFL']/e14['MNLEGTOTAL']
e14['MNGOVPERC'] = e14['MNGOVDFL']/e14['MNGOVTOTAL']
e14['MNSOSPERC'] = e14['MNSOSDFL']/e14['MNSOSTOTAL']
e14['MNAUDPERC'] = e14['MNAUDDFL']/e14['MNAUDTOTAL']
e14['MNAGPERC'] = e14['MNAGDFL']/e14['MNAGTOTAL']
I create a new column for each of the offices and calculate the percentage of votes they received. Now that I have the results, we can calculate the base democratic performance and the average democratic performance for each district.
dfl_totals14 = ['USSENDFL', 'USREPDFL', 'MNLEGDFL', 'MNGOVDFL', 'MNSOSDFL', 'MNAUDDFL', 'MNAGDFL']
dfl_percs14 = ['USSENPERC', 'USREPPERC', 'MNLEGPERC', 'MNGOVPERC', 'MNSOSPERC', 'MNAUDPERC', 'MNAGPERC']

min1 = lambda x: x.min()
avg1 = lambda x: x.mean()

e14['DEMBASE_CNT'] = e14[dfl_totals14].apply(min1, axis = 1)
e14['DEMBASE_PCT'] = e14[dfl_percs14].apply(min1, axis = 1)
e14['DEMAV_CNT'] = e14[dfl_totals14].apply(avg1, axis = 1)
e14['DEMAV_PCT'] = e14[dfl_percs14].apply(avg1, axis = 1)

e14['Year'] = '2014'
The first thing we do is create lists for the totals and percentage columns that we use to then apply our lambda formulas. "DEMBASE" finds the worst performing democratic candidate by row and appends to a new column. "DEMAV" calculates the average performance for each row and appends to a new column. The final line adds a column with the year for later use. This process is repeated for 2012.
Now I have two dataframes with the results columns, DPI, and Dem Base. Next I append year to the name of all the columns. This lets me reference the proper year once the data is merged together.
df_list = [e12, e14]

for df in df_list:
    df.columns = [col + (df['Year'][1]) for col in df.columns]
The next step is to merge them together into one unwieldy spreadsheet. Keeping it in a dataframe makes it much more manageable than trying to keep it all organized in Excel.
emaster = pd.merge(e12, e14, left_on = 'MNLEGDIST2012', right_on = 'MNLEGDIST2014', how = 'inner')
emaster.shape[0]
This merges all of the dataframes into one huge dataframe called emaster (I really need to get better at naming these things) using an inner join based on district. The second line of code prints out the total number of rows. Now that the data is in one place, we can average across the years to get more robust estimate for the DPI and Dem Base.
cols2 = ['MNLEGDIST2014', 'DEMBASE_PCT2012', 'DEMBASE_PCT2014']
demBaseP = emaster[cols2]

demBase = demBaseP.mean(axis = 1, numeric_only = True)
demBase = pd.DataFrame(demBase)

cols3 = ['MNLEGDIST2014', 'DEMAV_PCT2012', 'DEMAV_PCT2014']
demAvP = emaster[cols3]
dpi = demAvP.mean(axis = 1, numeric_only = True)
dpi = pd.DataFrame(dpi)
The above code filters down to the Dem Base and DPI columns before calculating an average for each of them in separate data frames. Then I can use the code below to create a dataframe with only the district, DPI, and Dem Base.
district_list = emaster['MNLEGDIST2014']

stats = pd.concat([district_list, demBase, dpi], axis = 1)
stats.columns = ['District', 'DemBase', 'DPI']
I can now join the "stats" dataframe to the original emaster dataframe for even more columns.
to_merge = ['MNLEGDIST2014', 'DEMBASE_CNT2014', 'DEMBASE_CNT2012', 'TOTVOTING2012']

districts = pd.merge(stats, emaster[to_merge], left_on = 'District', right_on = 'MNLEGDIST2014', how = "inner")
districts.head()
With everything joined back together again, we can calculate the Off-year dem base and use that to calculate the Drop-off Dem numbers.
cols_for_final_stats = ['District', 'DPI', 'DemBase']
stateHouseStats = districts[cols_for_final_stats]
stateHouseStats = pd.DataFrame(stateHouseStats)
stateHouseStats.head()
I now have a dataframe with the District, DPI, Dem Base, Off-Year Base, and Drop-off Dems. This can easily be combined wiht the data from our first post to get the State House results, Incumbency status, and current party. Eat your heart out NCEC.
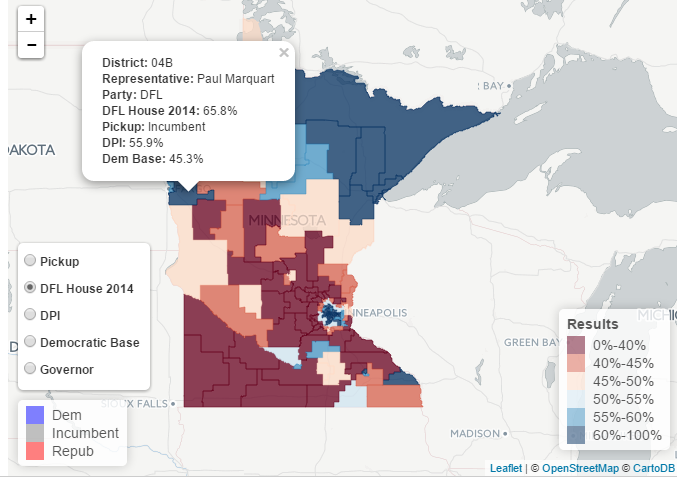
That's plenty of code for one post. I will save the mapping portion for later. Stay tuned for how to add this data to a map with interactive controls to select which data to show on the map. Preview here
Comments
comments powered by Disqus