It's that time of year again: election prediction season! Not to be left out, I have pulled together a prediction for the election. Using data from Pollyvote, I aggregated state level polls from the past 100 days and used them run simulations of the election.
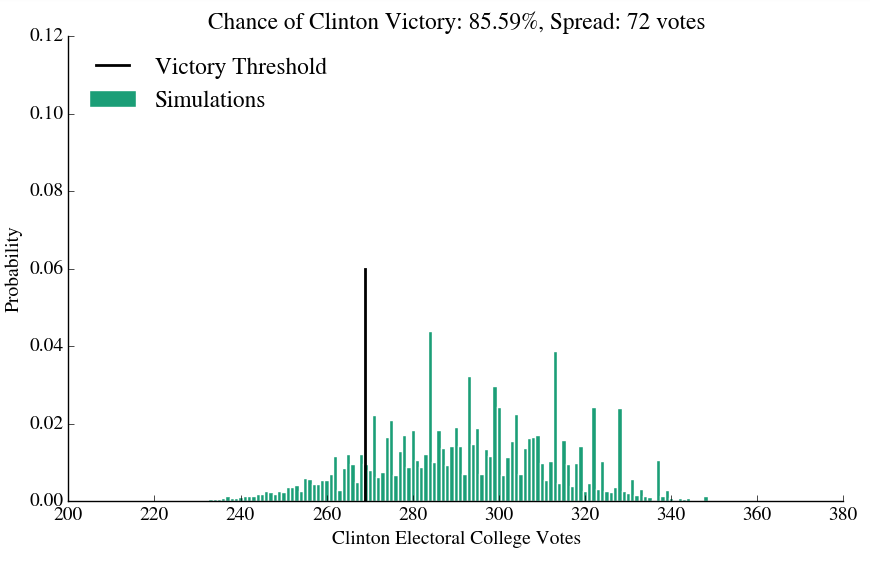
The graph above shows the results of 10,000 simulations and the probability of each total of electoral votes. The map of results is below.
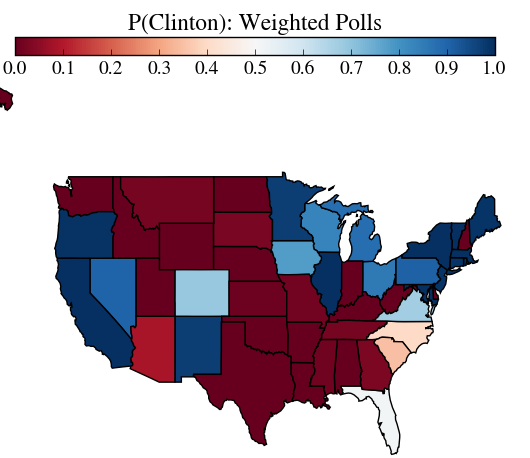
You can see that Florida once again hangs in the balance. I'm calling it for the Dems, but it will (as always) be a close call. North Carolina is also looking closer than I expected but still leaning Republican. Despite all of the press to the contrary, my simulation shows Michigan, Ohio, and Pennsylvania in the Clinton camp.
I will post a follow-up with more details about the methodology and code used to generate the predictions, but in the meantime thank you to 538, Pollyvote, and Harvard's CS109 for inspiration/data/code.
Be sure to vote tomorrow!
Comments
comments powered by Disqus