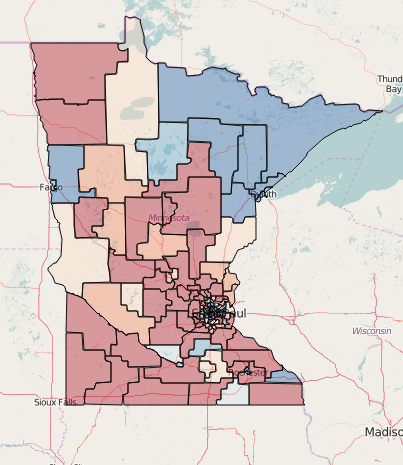
When I was working on campaigns, I was constantly asked to put data onto a map. Whether it was previous election results, canvassing updates, or lawn sign locations, there was never anything quite like seeing data on a map. Too often my bosses were unwilling to wait a few minutes, much less a few hours, to see drafts of the maps. In those moments Folium can be an invaluable tool to quickly create maps.
Folium is based on Leaflet and simplifies several parts of the process including binding data to shape files, generating Javascript (for interactions), and generating HTML.
For this project let's use our data from the previous post and create an interactive map with zoom and panning capabilities. We will be using the Folium Python package to create the maps.
In order to get the maps Jupyter notebook, I used some helper functions from OUseful.Info, the blog... and their shared notebook. I will be using the embed function and patcher. To be safe, I added all of their functions to my original notebook.
All you need to get started is the data (unsurprising) and a map file in geojson. Start your Jupyter notebook then import the libraries and helper functions from OUseful.Info into the notebook.
import pandas as pd
import folium
import json
import numpy as np
from IPython.display import HTML
For our data, we will take the dataframe from the last post and make a quick conversion so that the percentage columns map correctly in Folium.
data['DFL_Percentage'] = data['MNLEGPERC2014'] * 100
data['Dayton_Percentage'] = data['MNGOVPERC2014'] * 100
For our geojson file, I originally tried the Minnesota Legislative Coordinating Commission's download page, but had trouble getting the json file to work correctly. Eventually, I found a different copy that I have made available in the github repo .
The code for creating the map is below, I will walk through each part of the code separately.
MN_COORDS = [44.9543070,-93.1022220]

stateHouse_map = folium.Map(location = MN_COORDS, zoom_start = 10)

stateHouse_map.geo_json(geo_path = District_geo,
          data_out="data1.json",
          data=data,
          columns=['Name','DFL_Percentage'],
          key_on='feature.properties.name',
          threshold_scale=[ 40, 45, 50, 55, 60],
          fill_color = 'RdBu',
          fill_opacity=0.4,
          line_opacity=0.9,
          legend_name = 'Vote Percentage',
          reset="True")
stateHouse_map.create_map(path='sthouse.html')
embed_map(stateHouse_map)

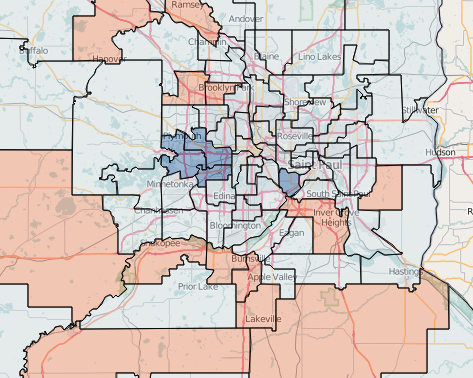
The first section with "MN_COORDS" starts the map focused on those map coordinates. That is the lat/long for the state capitol, which I looked up on Google. The next line creates an instance of the folium.Map class and starts it zoomed at 10 (picked by trial and error).
Next we reference the map class, where the geographic data is stored (relative path),and what we should name the json data output created by the Folium. The "columns" section specifies which column is joined from the data file. The first feature listed, in this case 'Name", needs to be the key used to join data to the map.
The "key_on" section was the trickiest for me when creating the map. It always start with "feature." and then link it up to the JSON features in the file. In my original file, the feature layer was named "features" but Folium requires it to be named "feature.". The rest of the specifications (properties.name) were from the actual geojson file. Knowing this could have saved me weeks of fighting with the code.
The rest is pretty straightforward until
stateHouse_map.create_map(path='sthouse.html').
This tells Folium to save the map as an html in the relative path listed. The embed command uses the helper function I found here to embed the map in the Jupyter notebook. The interactive map will display when on my local computer, but it is not rendered when the notebook is opened on Github.
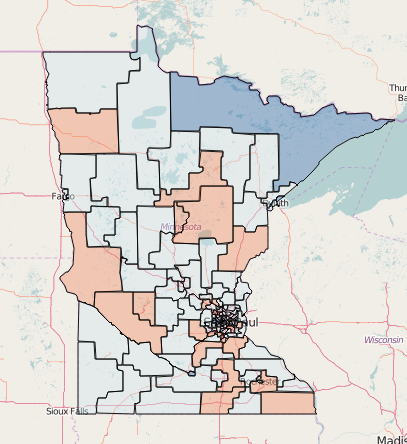
One big advantage of Folium is that you can quickly create new maps using small code tweaks to help with data exploration. With a slight modification to the above code and I can create a new map of which party picked up seats in 2014.


flip_map = folium.Map(location = MN_COORDS, zoom_start = 10)

flip_map.geo_json(geo_path = District_geo,
          data_out="data3.json",
          data=data,
          columns=['Name','Pickup_code'],
          key_on='feature.properties.name',
          threshold_scale=[0,0.25,1,1.75,2],
          fill_color = 'RdBu',
          fill_opacity=0.4,
          line_opacity=0.9,
          legend_name = 'Pickup',
          reset="True")
flip_map.create_map(path='flip.html')
embed_map(flip_map)
In the next part of this series, I will create some more analysis from the past election returns. Maybe I'll even put those on a map...
Comments
comments powered by Disqus