Overview
Curious about a project I've written about in the past? I will be updating the descriptions here and including links. My goal is to have a post for all of the listed projects once they are completed.
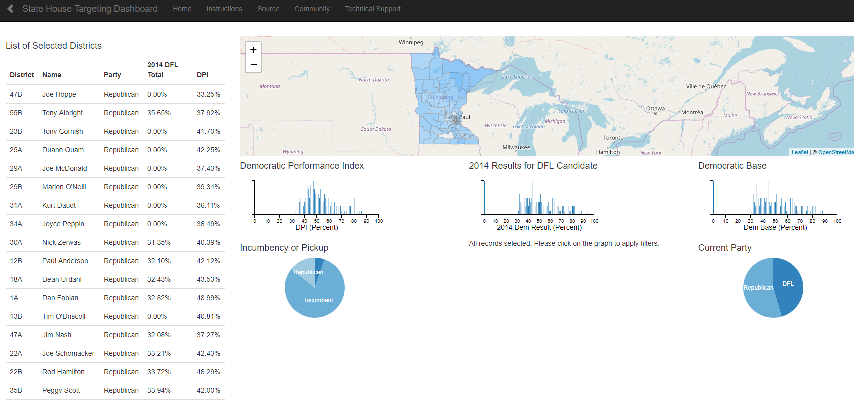
Dashboard for Targeting Competitive House Races in Minnesota
I wanted to build a tool I wish I had when I was a State Data Manager - an interactive dashboard to sort out the data about what will be the most competitive races. While interactive data tools such as Tableau have become more common, the high cost (both monetary and technical) are still a huge barrier to many organizations. I built this dashboard using only open source tools including javascript, d3.js, dc.js, and HTML.
It is currently a single-page app, and I plan on integrating it into a Flask or Django app. The live version of the dashboard is here
Statistical Modeling of Voter Behavior
After taking the Persuasion Analytics and Targeting class from Ken Strasma (full review here), I continued working on predictive voter modeling. The focus has been on trying new algorithms and data preparation pipelines to model partisanship and candidate preference. My language of choice has been Python and you can see the details of the work so far in the following blog posts focused on partisanship modeling and candidate support models. I am continuing to try new approaches and will publish my work on voter turnout modeling soon.
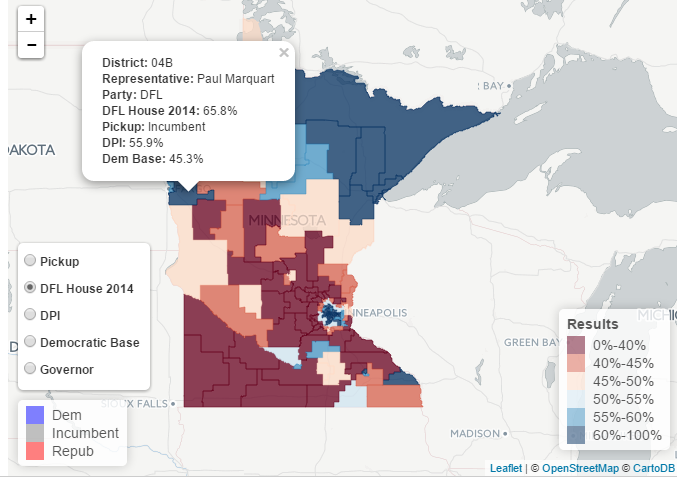
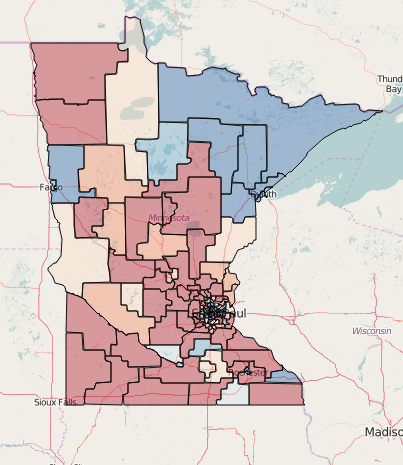
Election Results Mapping
There's got to be a better way to display election data on maps, right? There is a post on the blog (and another is on the way) that goes more in depth. Additionally, you can take a look at this github repo. As part of this effort, I have been trying to move away from static pictures and create more interactivity.
Interactive version available here
Election Statistics
While working on campaigns, I spent many hours pouring over targeting spreadsheets. These re-create a lot of the stastics used in precinct/district targeting such as DPI, Dem Base, Turnout, etc. The notebooks used to create the post are available here, and it contains a lot of additional analysis that I will post about soon.
Interactive version available here
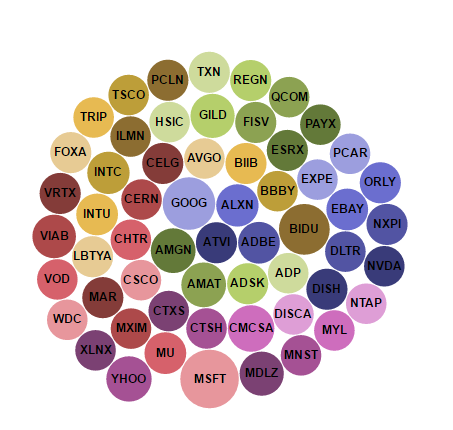
Flask and D3 Powered Web App
While working on some of the above projects, I became more interested on how to host some basic applications online. I found this tutorial at Real Python and decided to give it a try. The app creates a bubble chart with D3.js based on stock prices and volume. This was great tutorial, but I had some trouble deploying the app until I switched to Heroku for hosting. Live version is here and Github repo is here.